Prometheus
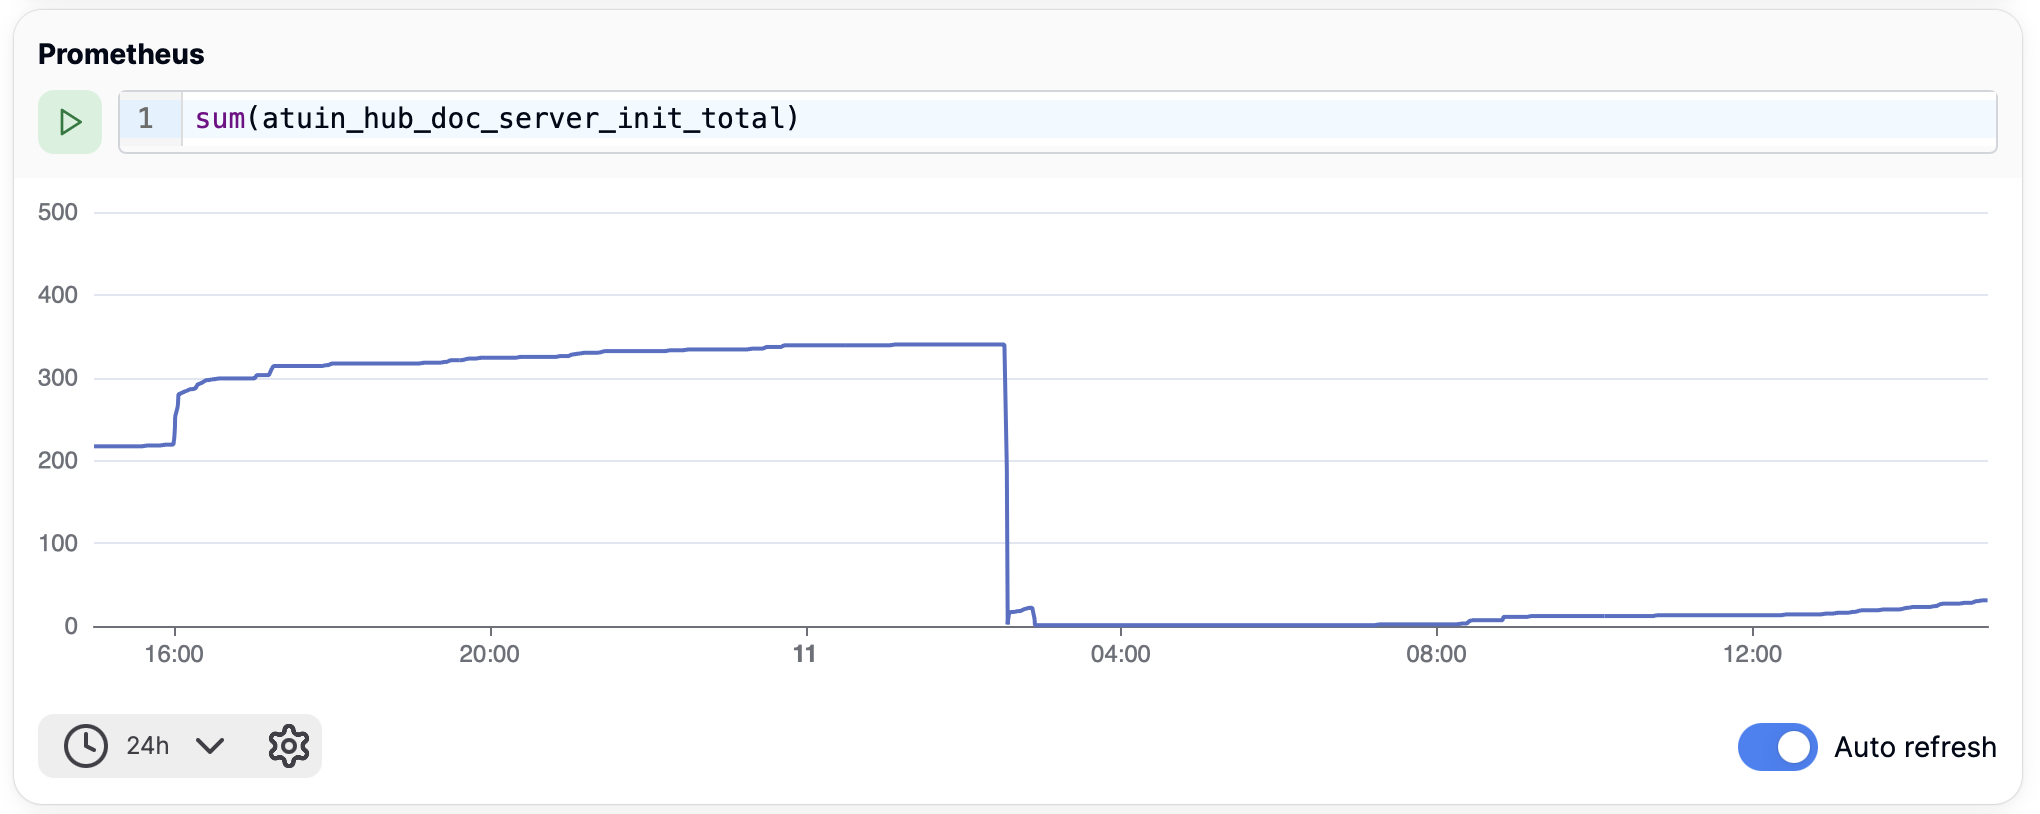
Use the Prometheus block to display a time series from a remote Prometheus server.
The server address can be configured in two ways
- From the block settings
- From the Atuin Desktop settings
This allows you to set a default endpoint, and then override it per-chart.
Block Output
Prometheus blocks produce structured output that can be accessed in templates after execution. See Block Output for general information on accessing block output.
Accessing Metrics Data
{%- set output = doc.named['my_prometheus_query'].output %}

{# Access series data #}
{% for series in output.series %}
  {{ series.name }}: {{ series.data | length }} data points
{% endfor %}
Output Fields
| Field | Type | Description |
|---|---|---|
results |
array | All query results |
first |
object | The first result (convenience accessor) |
series |
array | Time series data from the first result |
total_series |
number | Total number of series across all results |
result_count |
number | Number of query results |
query_executed |
string | The PromQL query that was executed |
time_range |
object | Time range of the query (start, end, step) |
Series Data Structure
Each series in the series array contains:
| Field | Type | Description |
|---|---|---|
name |
string | Series name (metric labels) |
data |
array | Array of [timestamp, value] pairs |
series_type |
string | Chart type (e.g., "line") |
Example Usage
{%- set output = doc.named['cpu_metrics'].output %}

{% if output.total_series > 0 %}
  Query: {{ output.query_executed }}
  Time range: {{ output.time_range.start }} to {{ output.time_range.end }}

  {% for series in output.series %}
  Series: {{ series.name }}
  Data points: {{ series.data | length }}
  {% endfor %}
{% endif %}